…would be a truly terrifying gamble without modelling and simulation. Its true that physical projects can take decades while software is built in weeks, but still, time passes before the results of your design decisions. Now, thanks to recent advances in genAI, insights previously only available after hundreds of production hours can instantly be simulated on your earliest digital prototypes. It is still up to PMs and designers to choose what to measure before it becomes expensive.
Which metrics?
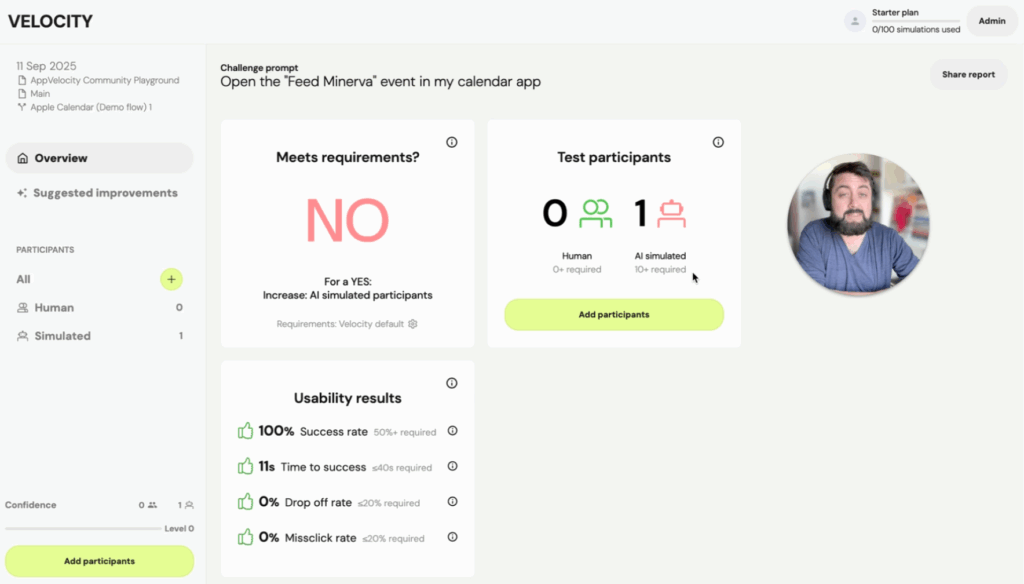
Whether your team states them openly or not, we all have presumed expectations. After challenging any prototype with Velocity, a report is always generated on how the actions of humans and simulations met a baseline of requirements. The aims of each report are adjustable. These metrics state the expectations between designers and PMs on what “good” looks like:
- Min number of Human & AI participants
- Success rate: % successful task completions
- Drop-off rate: % participants who gave up before success
- Miss-click rate: % accidental clicks
- Time-to-success: Avg time to completion
We’ve established some sensible starting points, but you’re free to adjust as needed. We’ve found that pushing these metrics slightly higher than the defaults can lead to some truly outstanding results, so don’t be shy. Setting these measures presents an opportunity for designers and product managers to collaborate and build trust.
Reports should aid not block
Reports show a clear “Yes” or “No” answer on whether participants, testing your designs, met the requirements you set. If the report says “No,” it’s not a failure—it’s an opportunity. Reports are not intended to block design through stubborn determination to meet unrealistic aims. Simulations should help identify what needs to be improved, like reducing the drop-off rate or increasing the success rate. This kind of data-driven feedback can act as a good starting point for discussions across stakeholders.
At your next design review, instead of just discussing designs, try supporting the conversation with a Velocity report. It’s a simple way to ensure diligence and move the conversation from opinion to a data-backed discussion. It’s a powerful tool for aligning your team and ensuring every design is a step toward a better product.
Ready to give it a shot? Try running a report for your next presentation and see how it changes the conversation.
Watch a video of how to configure requirements 🔗